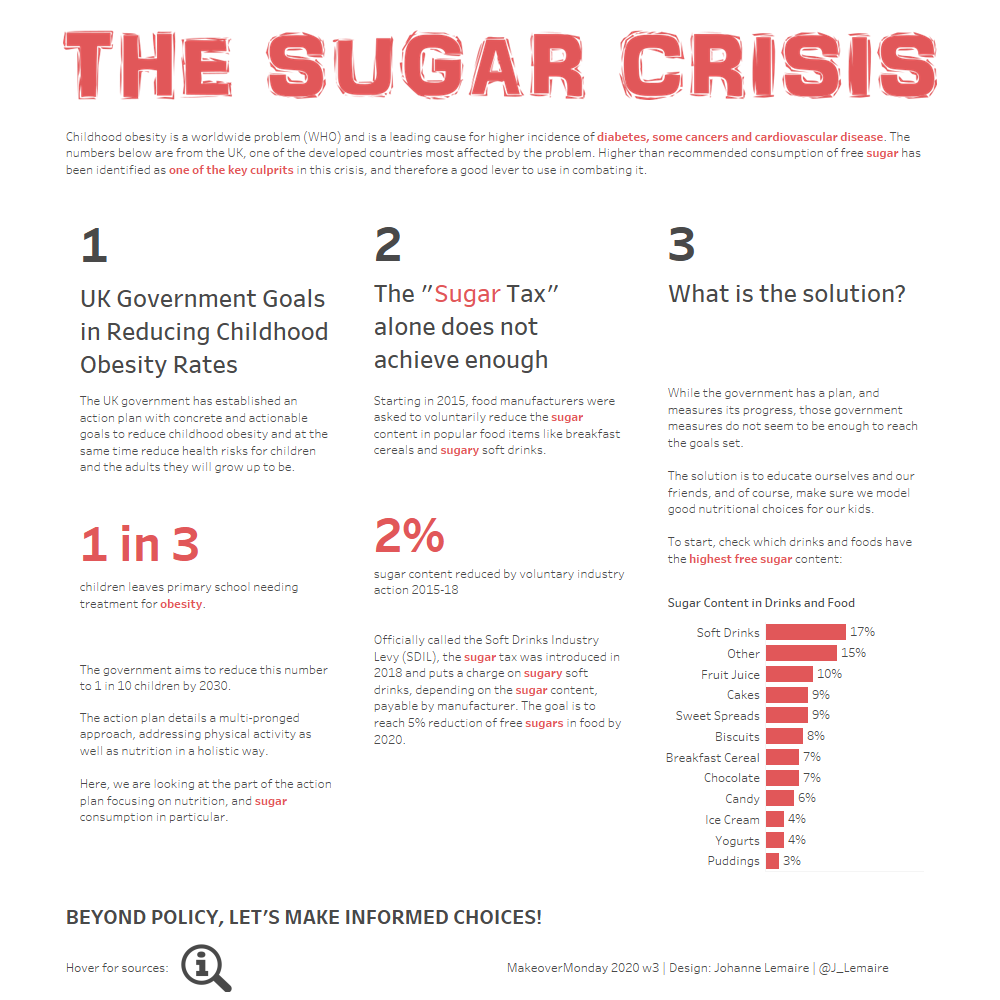
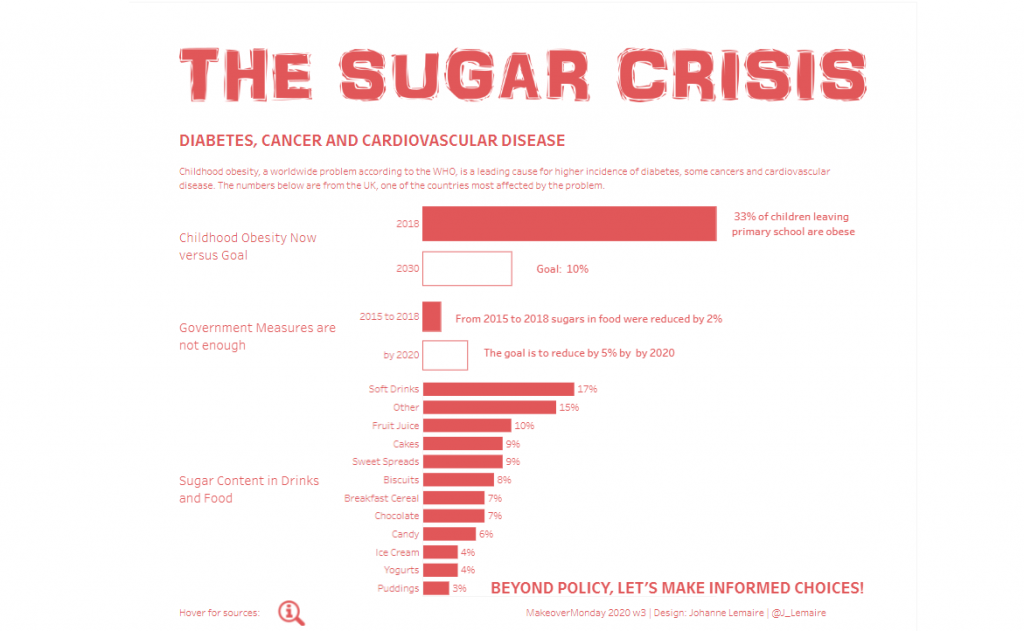
Iterating my Sugar Crisis Viz – MoM 2020 w 3
this is the
My takeaways from the webinar to iterate my viz, and what I did:
1) clearer separation between data sets, more white space What I did:
- increased the height of my fixed size dashboard
2) my choice of colour is not immediately clear — what does it mean What I did:
- leave the red only for the title, change the rest of text and graphics to grey
- checked the contrast of my chosen colours on accessible-colors.com, and change the red from the standard red in Tableau to one slightly darker, #DB383A
3) neither the story nor the takeaway are immediately clear and obvious What I did: Added text, added white space between the different sections.
- might change some things back to red to emphasize the crisis character
Lessons learnt: Sometimes taking away too much is not a good thing.
I think what that means for the way I build stories, is that I need to write and/or show my thinking in constructing and telling my story. And remove clutter and words only in the charts, where they might be superfluous.
I am happy with the changes made, but found that it took a lot of words to convey the story I wanted to tell. I’ll try to stick to something simpler next time.
See the after version below, or click through to it on Tableau Public