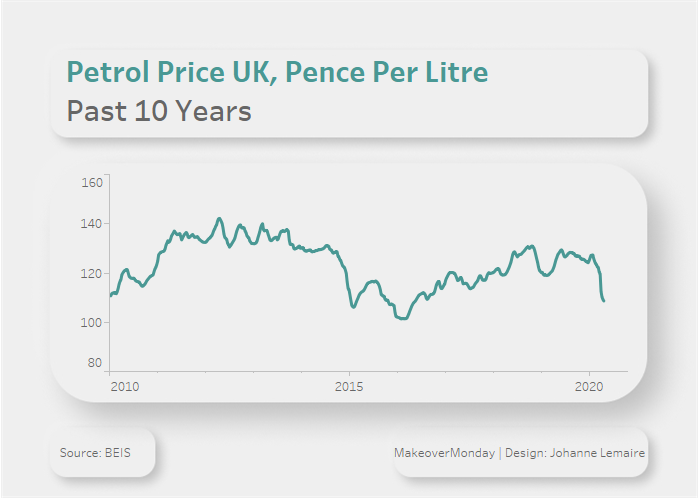
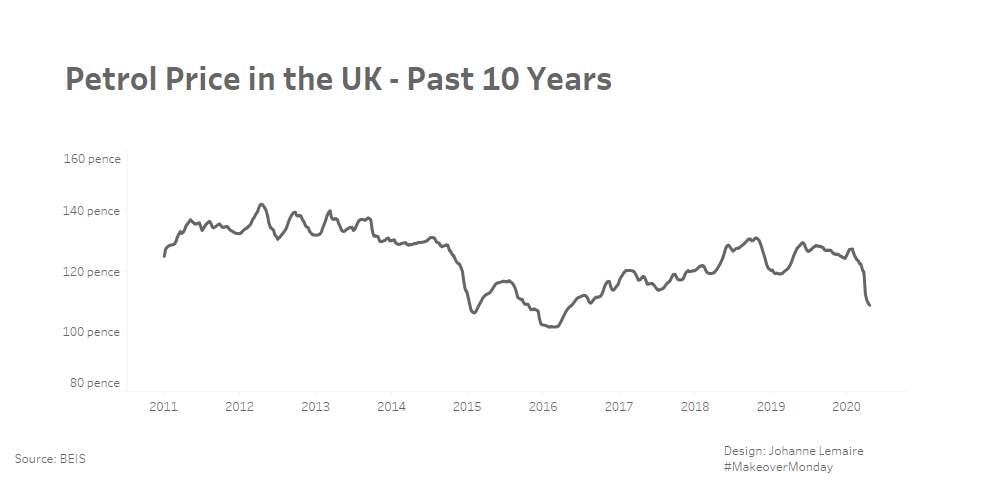
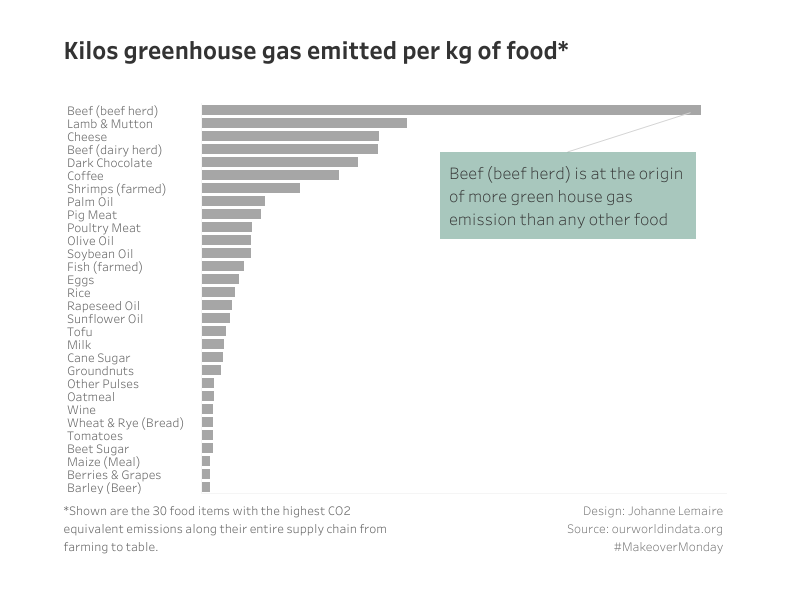
Iteration after Viz Critique
In business life, learning from feedback is what we do. Every day. And when you build tools for others, that involves a process where you ask lots of questions before you start, while you do, and after you do. And then you iterate. Personally, I believe that this is one of the most important skills […]


