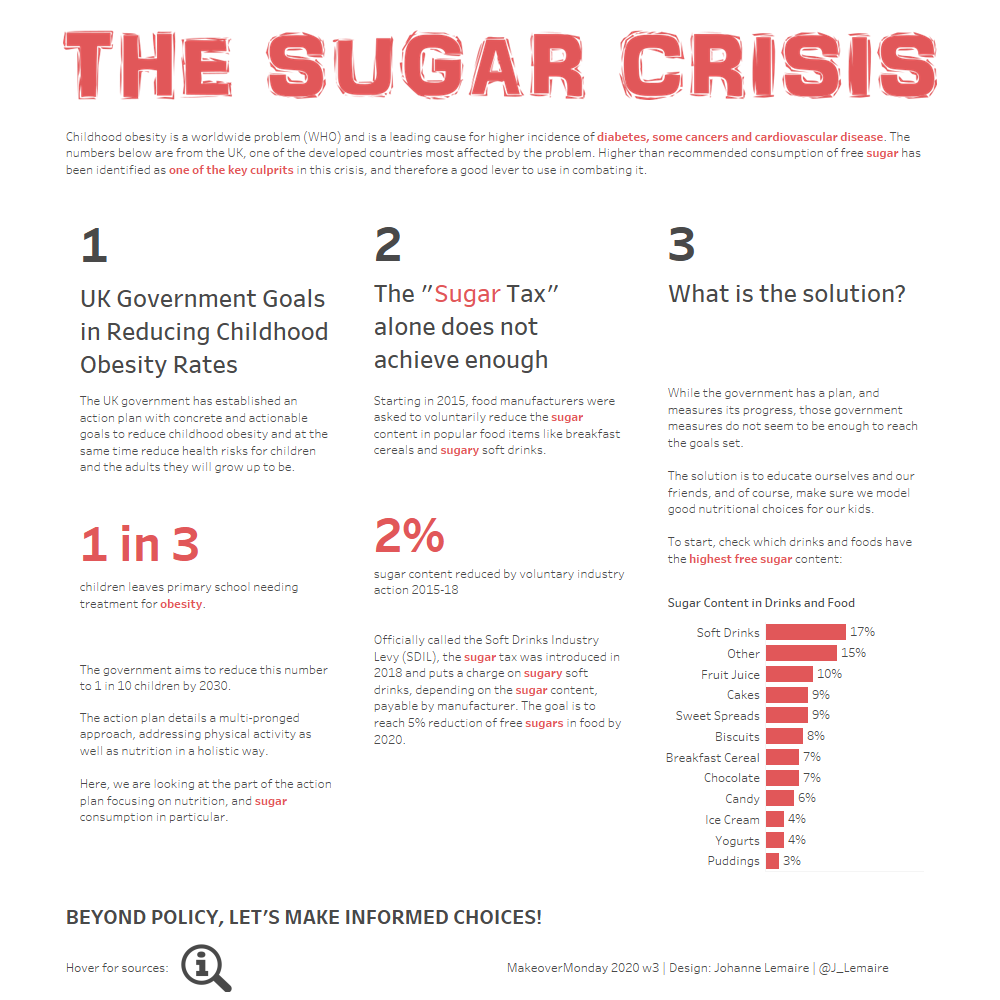
Iterating my Sugar Crisis Viz – MoM 2020 w 3
this is the
Tableau | Data analysis | Data storytelling
this is the
Taking more than a few hours for a viz, spending time to go back and forth on choices like colour palette, size of the dashboard, sourcing data. These things take time. And they are sort of annoying in Tableau, as it’s not indesign or Pagemaker or… Anyway, I can rant, or I can write a […]
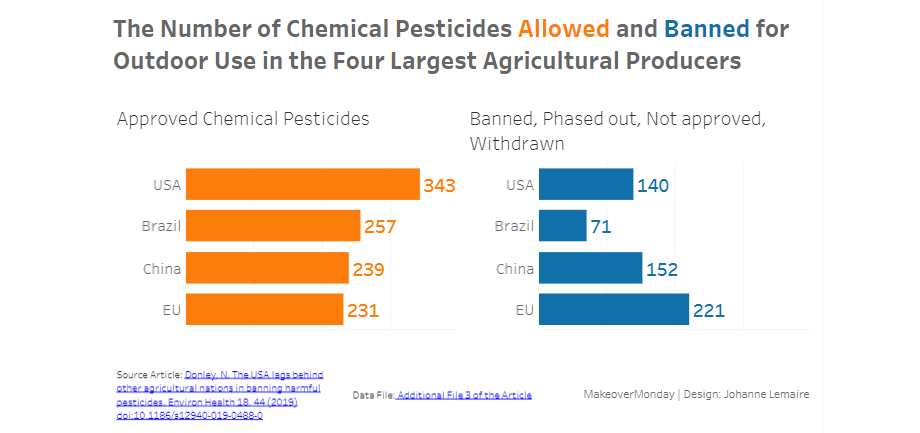
The team at MakeoverMonday gives us the above to make over. And I look into the three questions recommended for analysis/makeover: What works? Good colour contrast and legible What does not work so well? weird colour effect on the bars vertical orientation of the y-axis label “BRA” and “CHN” are not super readily recognizable as […]
Storytelling with Data’s January challenge is working with small multiples. I have been seeing these types of visualizations by accomplished Tableau public authors — and have been very intimidated by them myself. So, in the spirit of learning, and going beyond my comfort zone, I have decided to make a visualization using small multiples. But […]
I am so happy to have found this field of data visualization and to be able to progress and learn in this space. So, of course, I had to go and buy books, right? Just to recap, so far, in my learning journey to data visualization and data analytics, this is what I have been […]
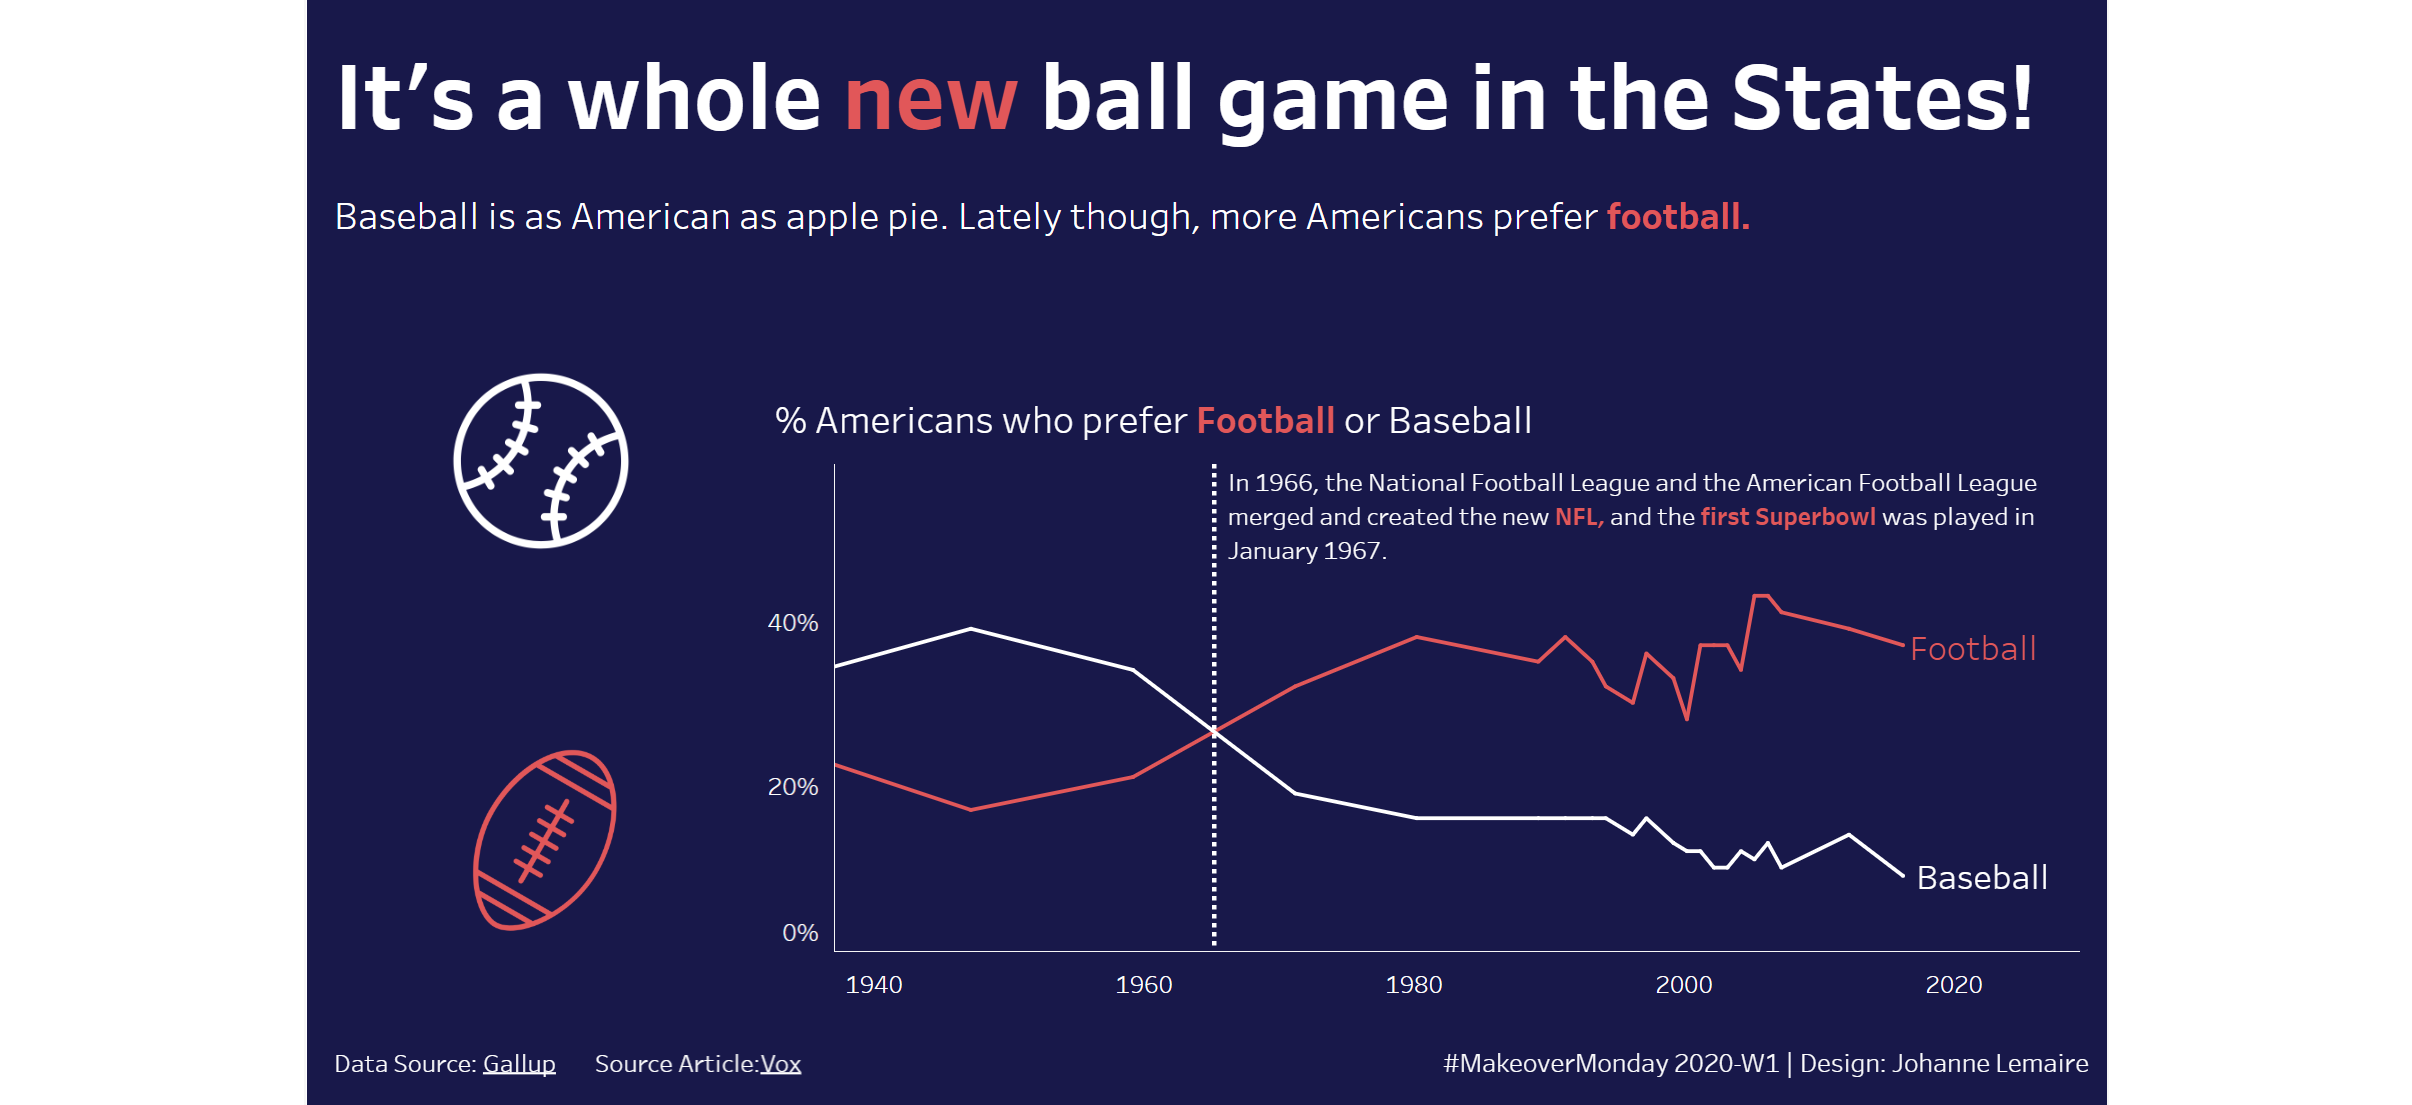
What I wanted to focus on this week, mostly because of what I thought could have been greatly improved from my work last week, is getting clearer on my story first, and then build the viz from there. The original Viz What works well The timeline on the x-Axis: it’s what we are used to […]